Sources
The Sources report provides complete analysis of traffic sources using channel grouping, UTM parameters, and referrers. Every row shows traffic (Entrances, Page Views, Bounce Rate) next to outcomes (Events, Conversions, Conversion Rate, Revenue), so you can compare sources by what they deliver, not only by volume.
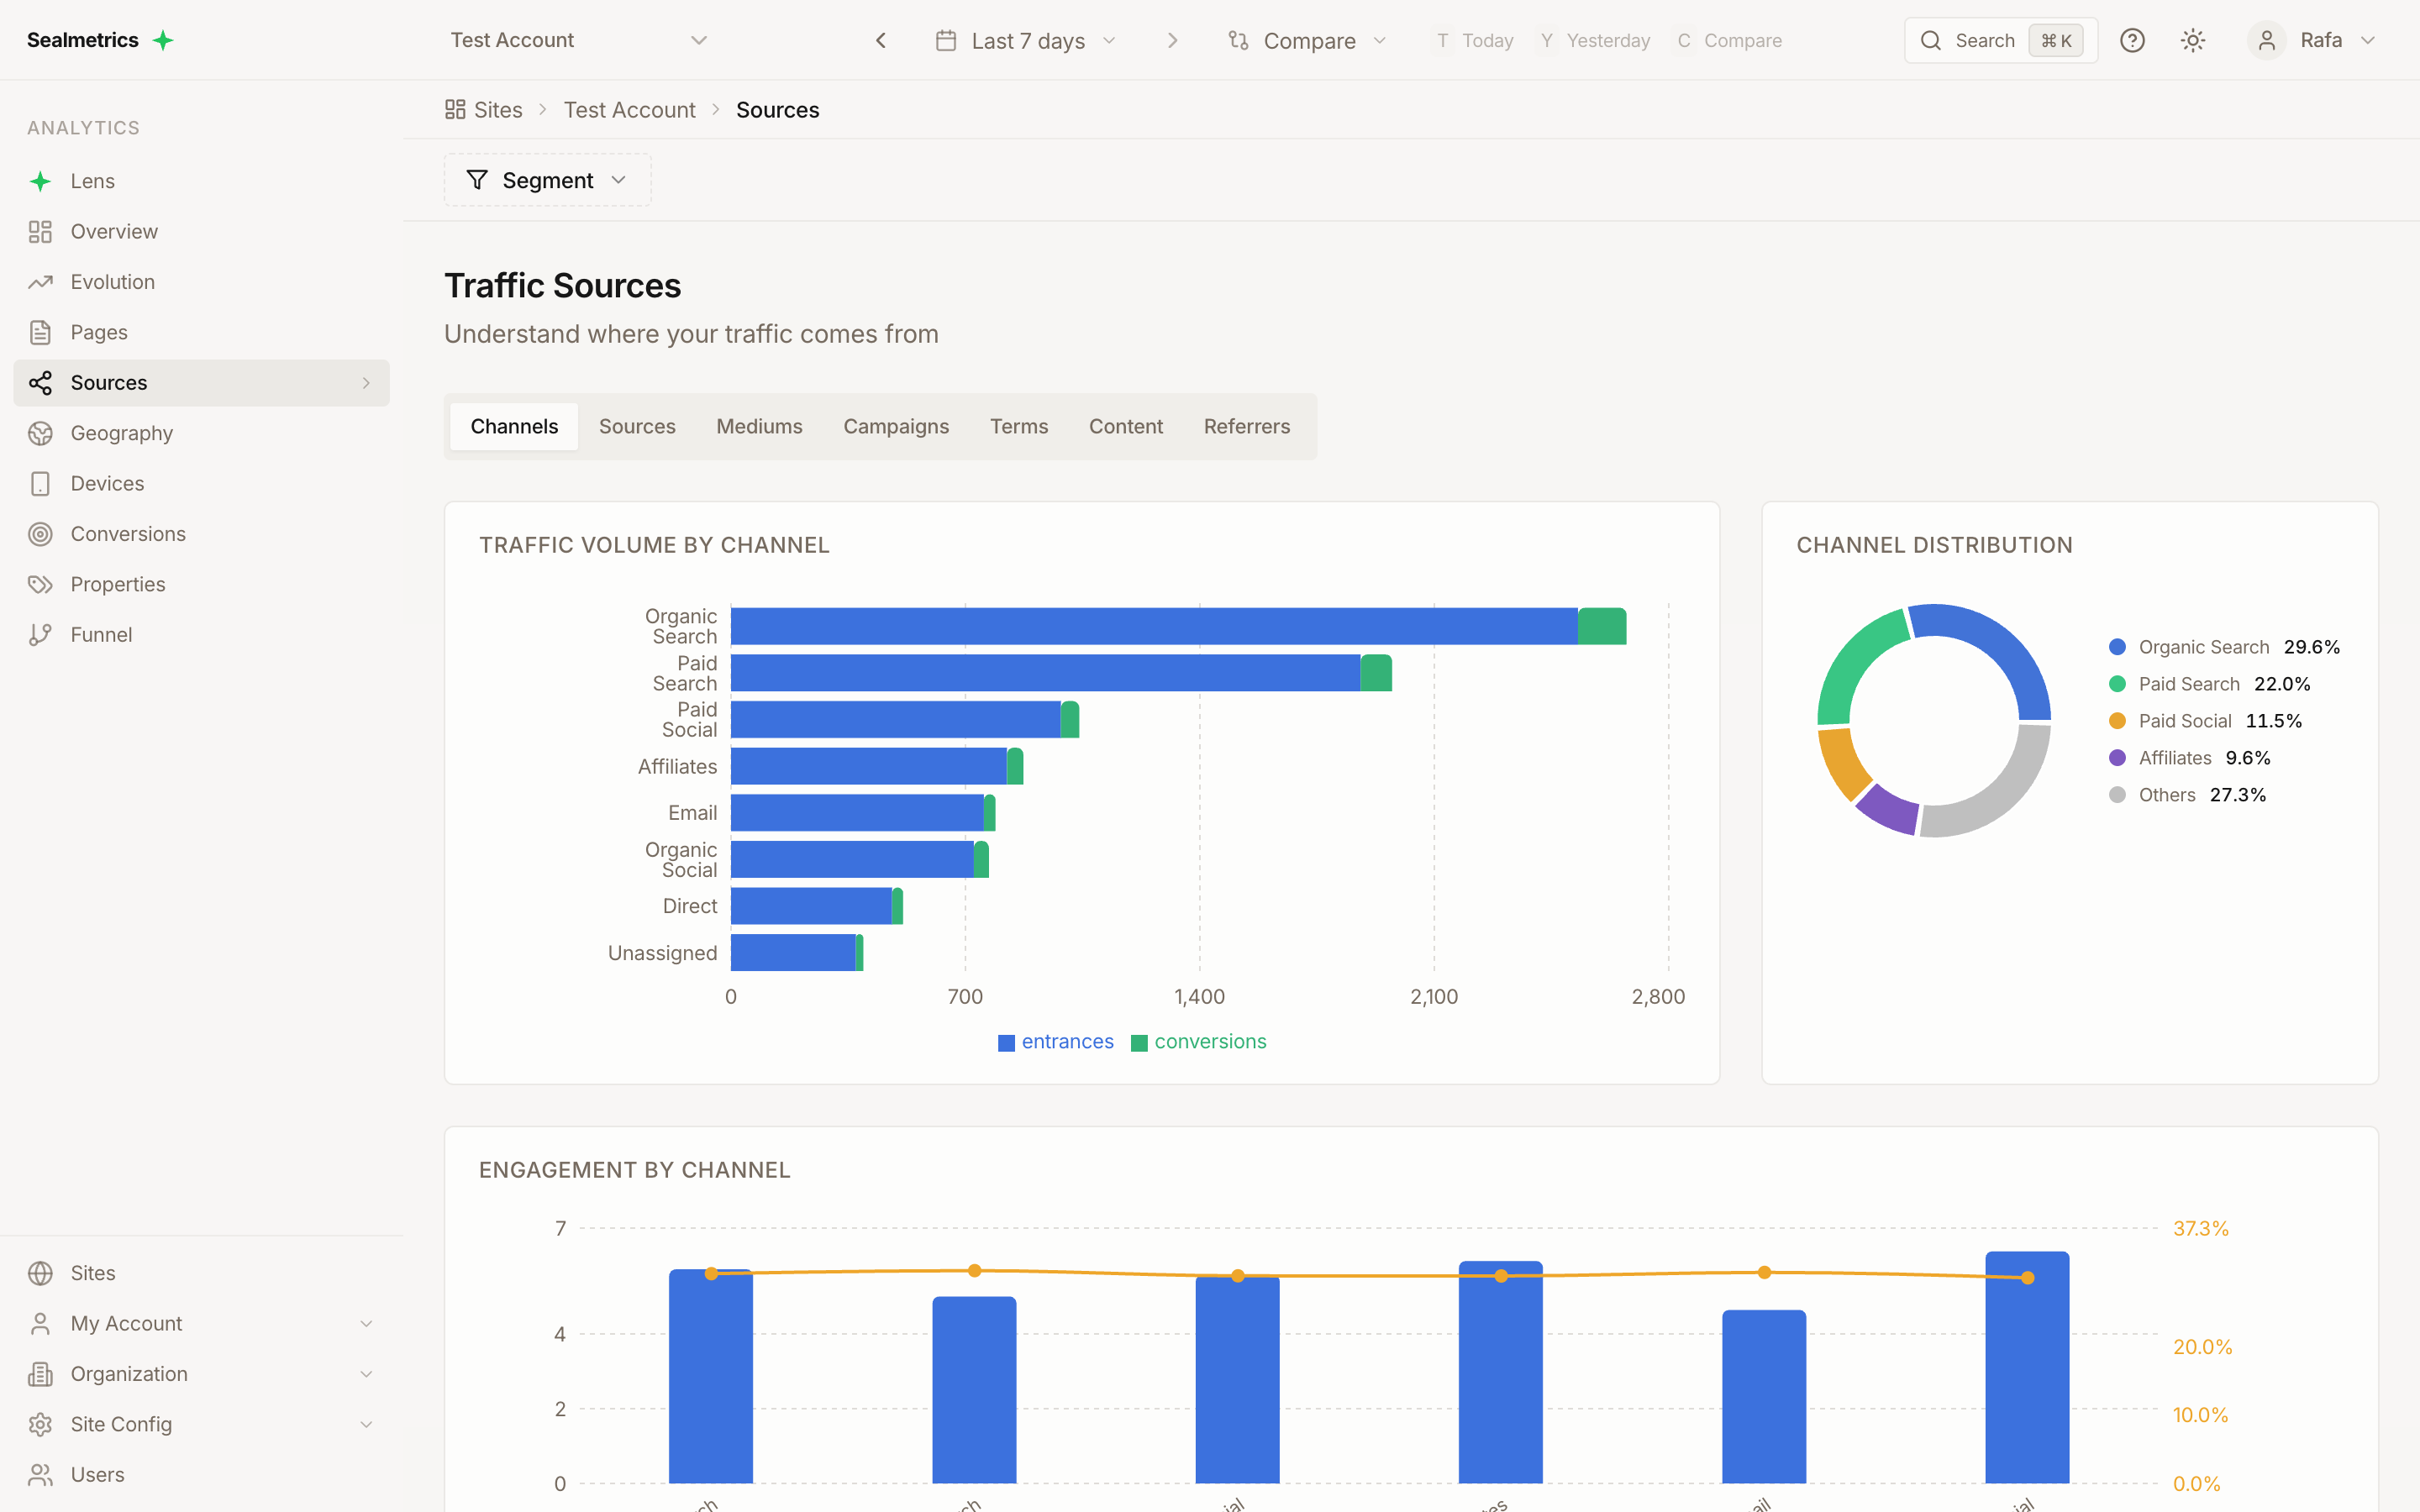
Accessing the Report
- Select a site from the site selector
- Click Sources in the sidebar
URL pattern: /sites/{site_id}/sources
Tabs
The report has 7 tabs for different levels of analysis. Channels is the first tab and is selected by default.
All seven tables share the same metric columns:
| Column | Description |
|---|---|
| Entrances | Sessions that started from this row's source |
| Page Views | Total page views |
| Bounce Rate | Single-page session percentage |
| Events | Microconversions (all microconversion types added together) |
| Conv. | Completed conversions (all conversion types added together) |
| Conv. Rate | Conversions / Entrances × 100 |
| Revenue | Sum of conversion amounts |
Metric definitions are in the Metrics Reference. Attribution is last click per session: each conversion is credited to the source of the session it happened in.
Every table also has:
- A search box — server-side and case-insensitive, so it searches all rows, not only the ones loaded on screen
- A Filters button with a dimension-only filter builder (see Filtering)
- An Export button (see Export)
- A Total row, calculated over all rows that match your filters
- Comparison values on Entrances, Page Views, Events, Conv. and Revenue when comparison mode is on in the date picker (Bounce Rate and Conv. Rate show no comparison)
1. Channels Tab
The default tab. Shows traffic grouped into high-level channels (GA4-style channel grouping). Instead of looking at raw source/medium values one by one, traffic is bucketed into marketing channels such as Paid Search, Organic Social, or Email.
| Column | Description |
|---|---|
| Channel | Channel name (e.g., "Paid Search"). Unmatched traffic shows as Unassigned |
| Entrances … Revenue | The shared metric columns above |
Charts included: Traffic Volume by Channel, Channel Distribution, and Engagement by Channel (see Charts).
Channels are not clickable — there is no drill-down from this tab.
How channel grouping works
Each session is assigned to a channel by matching its utm_source, utm_medium, and utm_campaign values against a set of channel grouping rules (channel_group_rules). Each rule defines:
- A channel name (e.g., "Paid Search")
- Optional regex patterns for source, medium, and/or campaign (an empty pattern means "match any value")
- A priority — higher-priority rules are evaluated first
Rules are checked in priority order and the first matching rule wins. Rules can be global (apply to every account) or account-specific; account rules are always evaluated before global rules, so a custom rule can override the defaults. Traffic that matches no rule is reported as Unassigned.
The channel is assigned when the visit is received, so rule changes apply to new traffic only — historical visits keep the channel they were given at the time.
You can view and customize these rules per account from the Channel Grouping settings (draft → test → publish flow, CSV import/export, and MCP tools). The API exposes them under /channel-groups. The built-in default rules cannot be deleted, but they can be overridden.
Default channels
Sealmetrics ships with the following default channels, listed here from highest to lowest priority (the order in which they are matched):
| Channel | Matches (simplified) |
|---|---|
| Paid Search | Search engines (google, bing, yahoo, etc.) with a paid medium (cpc, ppc, paid, paidsearch, sem) |
| Paid Social | Social networks (facebook, instagram, x, linkedin, tiktok, pinterest, etc.) with a paid medium (cpc, ppc, paid, paid-social) |
| Paid Video | Video platforms (youtube, vimeo, twitch, dailymotion) with a paid/video medium (cpc, ppc, paid, video, trueview) |
| Display | Display mediums (display, banner, cpm, interstitial, expandable, rich media), any source |
| Paid Shopping | google/bing with a shopping medium (shopping, pla, product listing) |
| Organic Search | Search engines with organic medium |
| Organic Social | Social networks with a social/organic-social medium, or no medium |
| Organic Video | Video platforms with a video/organic medium, or no medium |
| Organic Shopping | Shopping comparison sites (google shopping, idealo, kelkoo, pricerunner, shopzilla) |
| AI | Traffic from AI assistants (ChatGPT, Gemini, Claude, Perplexity, Copilot, etc.): medium ai, or an AI assistant as source with no medium |
| Email mediums (email, newsletter, mailchimp, sendgrid, klaviyo) | |
| Affiliates | Affiliate mediums (affiliate, partner, aff, cpa) |
| SMS | SMS mediums (sms, text, mms) |
| Push | Push mediums (push, notification, web push, mobile push) |
| Audio | Audio sources (spotify, apple podcasts, soundcloud, audible, etc.) |
| Referral | medium matches referral or referrer |
| Direct | source (direct) |
| Unassigned | Catch-all for traffic that matches no other rule |
2. Sources Tab
Shows traffic grouped by UTM Source and Medium combination.
Since July 21, 2026, visits arriving from an untagged external link are shown in this tab as their referring domain with medium referrer (e.g. reddit.com / referrer), GA4-style — including historical data. To analyze the referring pages, use the Referrers tab.
| Column | Description |
|---|---|
| Source / Medium | Combined source and medium (e.g., "google / cpc"). Direct traffic shows as (direct) / (none) |
| Entrances … Revenue | The shared metric columns above |
Drill-down: each Source / Medium is clickable — click it to open the Campaigns tab filtered to that source and medium, then click a campaign to open the Terms tab filtered to that campaign. A breadcrumb above the tabs shows the path; click any step to go back, or All Sources to clear the drill-down and return to the Channels tab.
Charts included: Traffic Volume by Source, Source Distribution, and Engagement by Source. The charts label each bar with the source name only.
3. Mediums Tab
Shows traffic grouped by UTM Medium only. Common values:
| Medium | Description |
|---|---|
| organic | Search engine organic traffic |
| cpc | Cost-per-click paid traffic (when your ad links are tagged with it) |
| social | Social media organic traffic |
| Email marketing traffic (when your email links are tagged with it) | |
| ai | Referrals from AI assistants |
| referrer | Untagged links from other websites |
| referral | Links tagged as referral, and some recognized sites (e.g. Google News) |
| (none) | Direct traffic |
Same columns and charts as the Sources tab (the first column is Medium instead of Source / Medium). Each medium is clickable and opens the Campaigns tab filtered to that medium.
4. Campaigns Tab
Shows traffic grouped by UTM Campaign.
| Column | Description |
|---|---|
| Campaign | Campaign name (the associated source / medium is shown underneath). Traffic without a campaign shows as (not set) |
| Entrances … Revenue | The shared metric columns above |
Includes the same three charts as the Sources tab. Click a campaign name to open the Terms tab filtered to that campaign, source and medium.
Useful for:
- Comparing ad campaigns
- Tracking email campaigns
- Measuring promotional campaigns
5. Terms Tab
Shows traffic grouped by UTM Term (typically search keywords).
| Column | Description |
|---|---|
| Term | Search term or keyword (the associated source / campaign is shown underneath) |
| Entrances … Revenue | The shared metric columns above |
This tab shows a table only (no charts). Useful for:
- Paid search keyword analysis
- Understanding search intent
- Identifying high-value keywords
See What Is a TERM in Sealmetrics? for what ends up in this field.
6. Content Tab
Shows traffic grouped by UTM Content (for A/B testing ads).
| Column | Description |
|---|---|
| Content | Ad variant identifier (the associated source / campaign is shown underneath) |
| Entrances … Revenue | The shared metric columns above |
This tab shows a table only (no charts). Useful for:
- A/B testing ad creatives
- Differentiating links pointing to same URL
- Tracking banner variations
7. Referrers Tab
Shows untagged traffic from referring websites — the visits reported with medium referrer — one row per referring page. This is where you see exactly which page linked to you. (The domain-level view lives in the Sources tab, where referral traffic is grouped as domain / referrer.)
Search engines, social networks, AI assistants and other sites Sealmetrics recognizes are classified into their own source and medium (for example google / organic), so they do not appear in this tab.
| Column | Description |
|---|---|
| Referrer Domain | The referring page as host + path, without the query string (e.g. reddit.com/r/analytics/comments/...) |
| Entrances … Revenue | The shared metric columns above |
This tab shows a table only (no charts). Useful for:
- Identifying backlink traffic
- Finding partnership opportunities
- Monitoring press mentions
Charts
The Channels, Sources, Mediums, and Campaigns tabs each include three charts (the Terms, Content, and Referrers tabs show a table only). Charts always show the rows with the most Entrances, regardless of how the table is sorted:
Stacked Bar Chart
Traffic volume ("Traffic Volume by …"):
- Horizontal bars for the top 8 rows by entrances
- Each bar shows Entrances and Conversions
- Quick visual of volume vs conversion balance
Pie Chart
Distribution ("… Distribution"):
- Share of entrances for the top 4 rows, with the rest of the top 8 grouped as "Others"
- Percentage labels
Dual Axis Chart
Efficiency comparison ("Engagement by …"), for the top 6 rows by entrances:
- Bars: Conversion Rate
- Line: Bounce Rate
- Identifies sources with good conversion but high bounce
Charts respect global filters, the drill-down, and the table's filter builder, but not the table search box or the table sort.
Filtering
The Sources report is affected by three layers of filtering.
Global filters (Segment)
The global filters from the Segment panel apply to every tab of this report — tables, totals and charts:
| Global filter | Applies to Sources |
|---|---|
| Country | Yes |
| Device Type | Yes |
| Browser | Yes |
| Operating System | Yes |
The date range and comparison mode from the date picker also apply. See Filters for how global filters and segments work.
Table filters (filter builder)
Each tab has its own filter builder (the Filters button above the table). Filters in the Sources report are dimension-only — you filter by what the traffic is (channel, source, medium, campaign, term, content, referrer), not by metric values. The fields available depend on the tab:
| Tab | Filter fields |
|---|---|
| Channels | Channel |
| Sources | Source, Medium |
| Mediums | Medium |
| Campaigns | Campaign, Source, Medium |
| Terms | Term, Campaign, Source, Medium |
| Content | Content, Campaign, Source, Medium |
| Referrers | Domain (the referring page, as shown in the table) |
Operators: equals, does not equal, contains, does not contain, starts with, ends with, is empty, is not empty.
Things to know:
- All conditions are combined with AND. The builder shows AND/OR selectors, but in this report every condition is applied as AND.
- Matching is case-sensitive (
Googledoes not matchgoogle). Only the search box ignores case. - A value containing a comma is ignored — that condition is not applied.
- Filters are per tab: a filter on the Campaigns tab does not affect the Sources tab.
- Filters are resolved on the server, so they apply to all rows, the Total row and the charts.
| Example | Tab | Use Case |
|---|---|---|
| Channel equals "Paid Search" | Channels | One channel only |
| Source contains "google" | Sources | All Google traffic |
| Medium equals "cpc" | Sources, Campaigns | Paid traffic only |
| Campaign contains "spring" | Campaigns | One campaign family |
To spot high- or low-performing rows by metric (conversions, bounce rate…), sort by the metric column instead — every column is sortable. Entrances, Page Views, Events, Conv. and Revenue are sorted on the server across all rows. Bounce Rate, Conv. Rate and the name columns are sorted only within the rows already loaded (the top 100 by the current server-side sort), so sort by Entrances or Revenue first when you need a complete picture.
Combining Filters
Example: isolate paid Google traffic for one campaign, on the Campaigns tab:
- Source contains "google"
- AND Medium equals "cpc"
- AND Campaign contains "spring-sale"
Drill-down
Clicking a row in the Sources, Mediums or Campaigns tab adds an exact-match filter for that row and opens the next tab (see Sources Tab). Drill-down filters apply to the Sources, Campaigns and Terms tables, on top of any filter-builder conditions.
UTM Parameter Reference
| Parameter | URL Format | Example |
|---|---|---|
| Source | utm_source= | google, facebook, newsletter |
| Medium | utm_medium= | cpc, organic, email |
| Campaign | utm_campaign= | spring-sale, brand-2025 |
| Term | utm_term= | running+shoes |
| Content | utm_content= | banner-a, text-link |
Example URL
https://example.com/landing?utm_source=google&utm_medium=cpc&utm_campaign=spring-sale&utm_term=running+shoes&utm_content=banner-a
Use Cases
Evaluating Ad Spend
- Go to Sources tab
- Filter: Medium equals "cpc"
- Compare:
- Google vs Facebook vs LinkedIn
- Cost per conversion (external ad spend data + Conv.)
- Conversion rates
Comparing Campaigns
- Go to Campaigns tab
- Sort by Revenue (descending)
- Identify:
- Best performing campaigns
- Campaigns to scale
- Campaigns to pause
Finding High-Value Referrers
- Go to Referrers tab
- Sort by Conv. (descending)
- Look for:
- Unexpected high-performing referrers
- Partnership opportunities
- Guest posting targets
Analyzing Email Performance
- Go to Mediums tab
- Filter: Medium equals "email" (or the medium your email links are tagged with)
- Click the medium to see its campaigns, and compare Entrances, Conv. and Revenue per send
Sealmetrics sees the visit that follows a click; email opens and clicks stay in your email platform.
Keyword Analysis
- Go to Terms tab
- Sort by Conv.
- Identify:
- Converting keywords
- High-traffic low-conversion keywords (optimize landing pages)
- Long-tail opportunities
E-commerce use cases
These cases assume your store sends a purchase conversion with the order amount (sealmetrics.conv('purchase', amount)), so that Conv. and Revenue reflect sales. See Conversions and the E-commerce Setup Guide, or the e-commerce integrations for your platform.
Two things to keep in mind when reading the numbers:
- Conv. and Events add up all types. If you also send other conversions (a newsletter sign-up, a lead form), they are counted in Conv. and Conv. Rate next to purchases. Revenue only includes conversion amounts.
- Attribution is last click per session. A sale is credited to the source of the session in which it happened; earlier visits from other sources are not credited.
Which channels bring buyers, not just visits?
- Open the Channels tab and sort by Revenue (descending).
- For each channel, compare its Entrances with its Conv. and Revenue. Revenue ÷ Entrances gives you revenue per entrance, which you calculate yourself from the two columns.
- Check the Engagement by Channel chart for channels with a high bounce rate and a low conversion rate.
How to read it: a channel with a large share of entrances but little revenue is bringing visitors who don't buy — review targeting or the pages that traffic lands on. A channel with few entrances but high revenue per entrance is a candidate for more budget. Turn on comparison in the date picker to see whether a channel's revenue moved against the previous period.
Which campaigns bring buyers, not just visits?
- Open the Campaigns tab.
- Filter: Medium equals "cpc" (or the mediums your paid campaigns use).
- Sort by Revenue, then by Conv.
- Click a campaign to open the Terms tab for that campaign and see which keywords brought the sales (only if your ad URLs pass
utm_term— see How to Track Google Ads Campaigns).
How to read it: campaigns with many entrances and no Conv. are spending on visits that don't buy. Put Revenue next to the spend from your ad platform to get ROAS — the Sources report has no ad-cost data. Export the table as CSV to do this in a spreadsheet.
Do my campaigns fill carts that never reach checkout?
This case needs microconversions for the steps before the purchase — add_to_cart and begin_checkout. See Microconversions.
- Open the Campaigns (or Sources) tab.
- Compare Events with Conv. for each row.
- To narrow it to one device, apply a global filter (for example Device Type = Mobile) from the Segment panel.
How to read it: a campaign with plenty of Events but few Conv. brings shoppers who engage but don't finish — check what that audience meets at checkout (shipping costs, payment options, mobile checkout). The Events column adds up every microconversion type, so it can't tell add_to_cart from begin_checkout. For a per-step breakdown by source, medium and campaign, use the Funnel by UTM table in the Funnel report.
Is my Google Shopping / Performance Max traffic credited to the right campaign?
- Open the Channels tab and check the Paid Shopping row. It only collects google/bing traffic with a shopping medium.
- Open the Sources tab and search for
google. Look for rows with your product feed's own medium (for examplegoogle / product_sync) that show conversions. - Open the Campaigns tab and look for the feed's campaign value collecting sales that belong to your paid campaigns.
How to read it: if paid Shopping clicks show up under the feed's tagging, your own parameters are being overridden by the feed's. Fix it with UTM Mapping overrides. Mappings apply to new traffic only; earlier visits keep their original values.
Is my payment gateway taking credit for sales?
- Open the Mediums tab and look for the
paymentmedium. When Sealmetrics can't link a visitor coming back from a known gateway (for example PayPal, Stripe or Redsys) to their original session, the visit is recorded with that gateway as source andpaymentas medium (e.g.paypal / paymentin the Sources tab). No default channel matches it, so it counts as Unassigned in the Channels tab. - Open the Referrers tab and look for payment-provider or bank checkout pages with conversions. Gateways Sealmetrics doesn't recognize show up here and as
domain / referrerin the Sources tab.
How to read it: conversions on these rows are sales whose real source (an ad, an email) was lost at the payment step. Register the gateway domain as a passthrough referrer — see How to Avoid Conversions Being Attributed to "Payment". The change applies to new sessions.
Export
Each tab has its own Export button:
- CSV or PDF format
- Exports the current tab only
- Respects the search box, the filter builder, the drill-down and the current sort
- Exports the rows loaded in the table (up to 100), not only the page you are viewing
- Source and Medium are exported as separate columns; the Campaigns export also includes Source and Medium, and the Terms and Content exports include Campaign, Source and Medium
- Comparison values are not included
Related documentation
- Referral vs Direct Traffic — How each session's source is classified
- How Sealmetrics Calculates SEO Traffic — How organic search is detected
- How to Track Google Ads Campaigns — UTM templates for paid campaigns
- What Is a TERM in Sealmetrics? — What the Terms tab measures
- Channel Grouping — Customize how traffic is grouped into channels
- Funnel Report — Microconversion and conversion steps by source, medium and campaign
- Filters — Global filters, segments and the filter builder
- Overview Report — The high-level dashboard for all reports